My Weather station
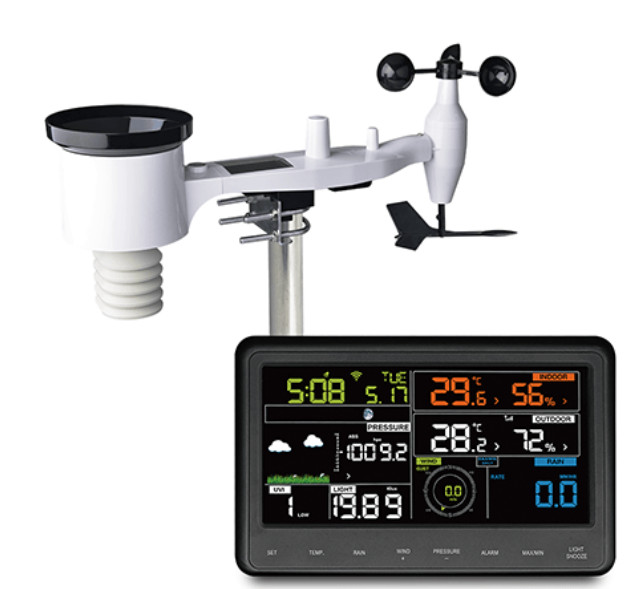
In October 2019 I installed an Ecowitt WH2910C weather station which I purchased from Amazon Australia. The cost was about $180.

Assembly was very simple. The sensors connect to the console using Bluetooth, and the console connects to your wireless network to upload your data to the web.
An app is used to complete the configuration, and this app, WS-View, also gives you a display of the data on your phone.
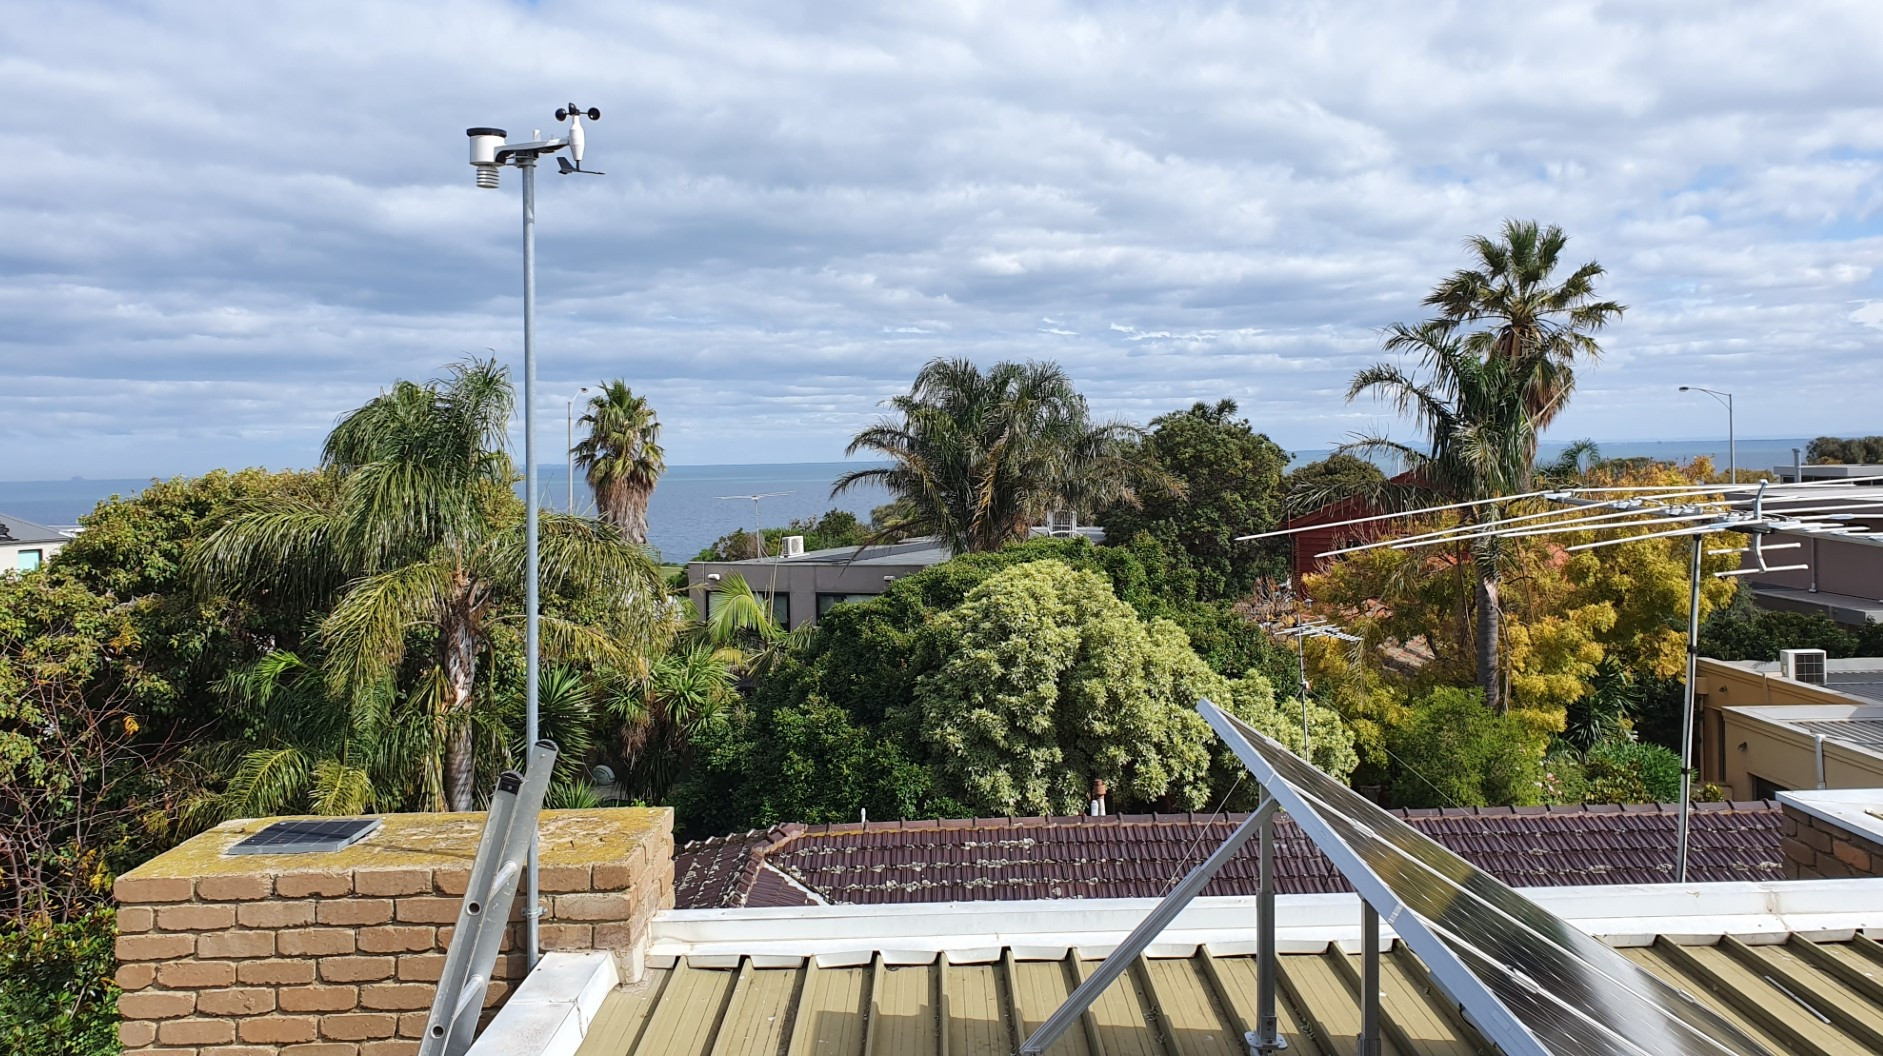
I mounted it on a galvanised steel pole attached to our chimney by two brackets.
I was a bit concerned that heat rising from the chimney might be an issue, but it is a couple of metres higher and offset somewhat to the side of the flue hole so in the end I discounted that as an issue. It is also high enough above the colourbond that radiated heat will not be an issue either, I hope.
The supplied console gives a summary of the measured data and is configurable to some extent by a row of buttons along the bottom. These buttons have labels indicating their function but the colour is very faint and can be a hard to see.
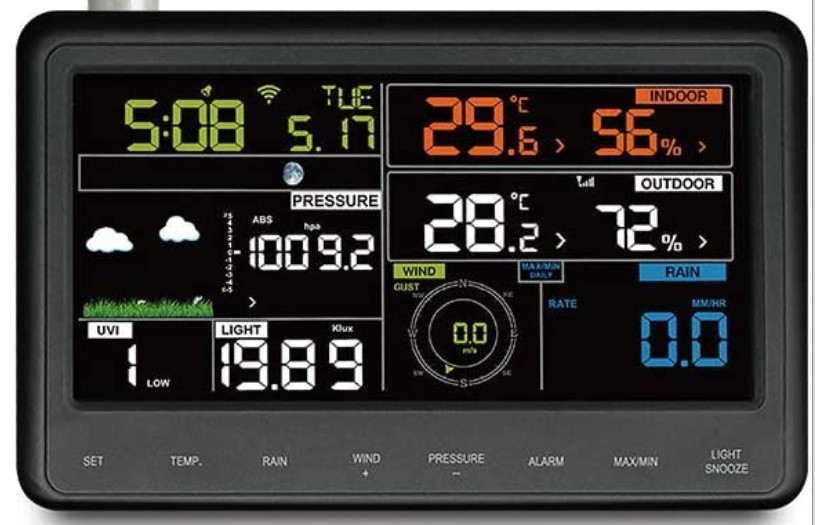
One slight disadvantage with this model is that the Rainfall is configurable to show Rate (mm/hr), Day, Week, Month and All Time but not Year to date.
The buttons along the bottom allow the change to similar different measures for each of the main metrics.
The barometric pressure needs to be calibrated for your local altitude. Knowing our height above sea level, I used the data from Moorabbin Airport, which is not too far away, to determine the values I need to perform the calibration.
There are indicators to show the strength of the Bluetooth to the mast head instruments, and the wireless network connection.
The console has a backup battery to maintain the data and Bluetooth connection, but it needs to be powered with a plug pack to upload data to the web via the wireless network, and to illuminate the digital readings.
I can view the data uploaded to the web three ways.
A) The WS-View App
The WS-View app is downloaded from the Android Play Store (and presumably from the Apple App store) and is used to set up the console and connect it to the wireless network.
Following this, it can also be used to display the data remotely. The console uploads the data to the Ecowitt web site and then the app downloads it from there and presents it in different ways. Here are some screenshots to demonstrate this.
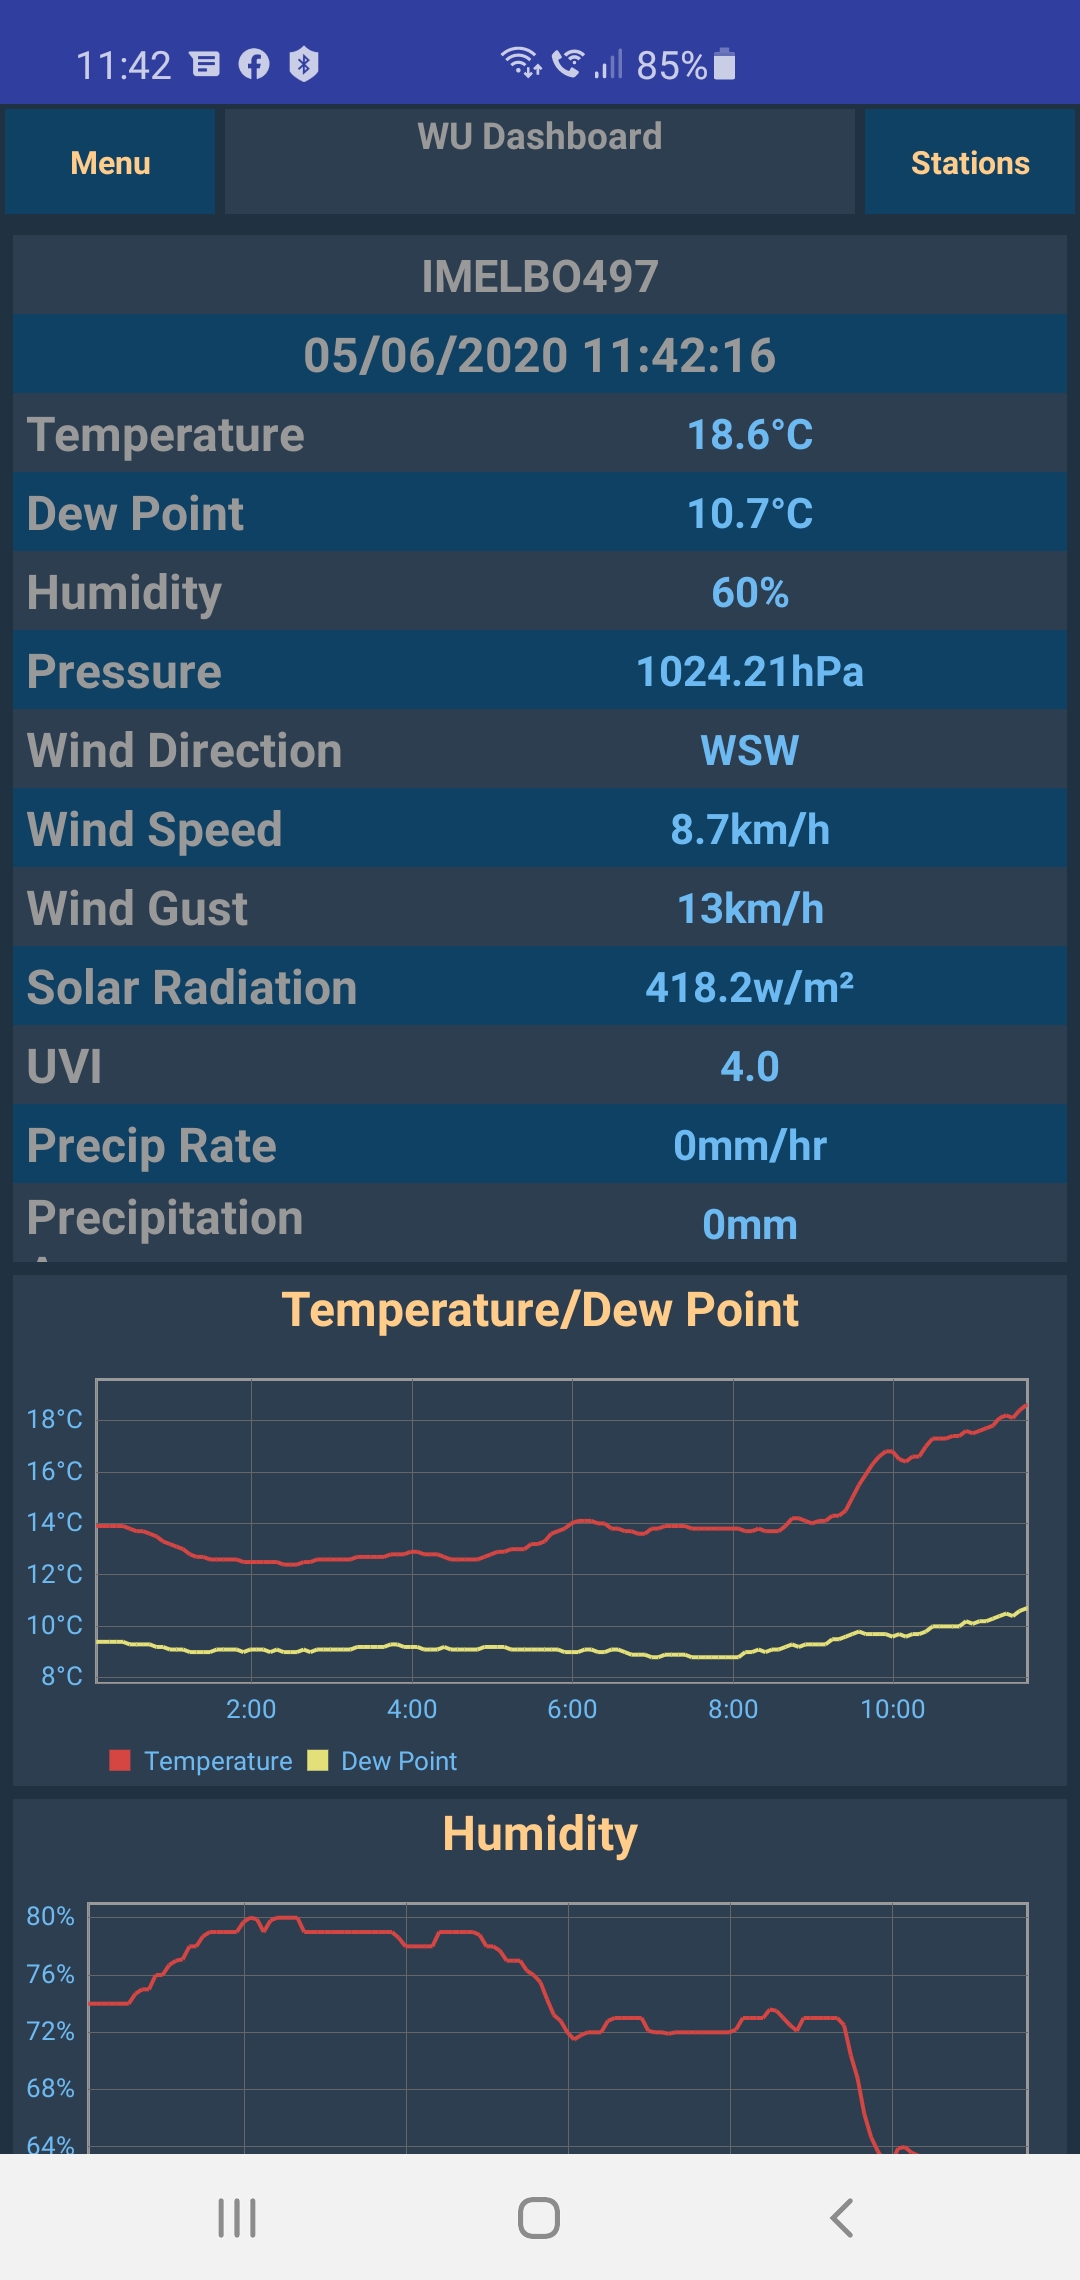
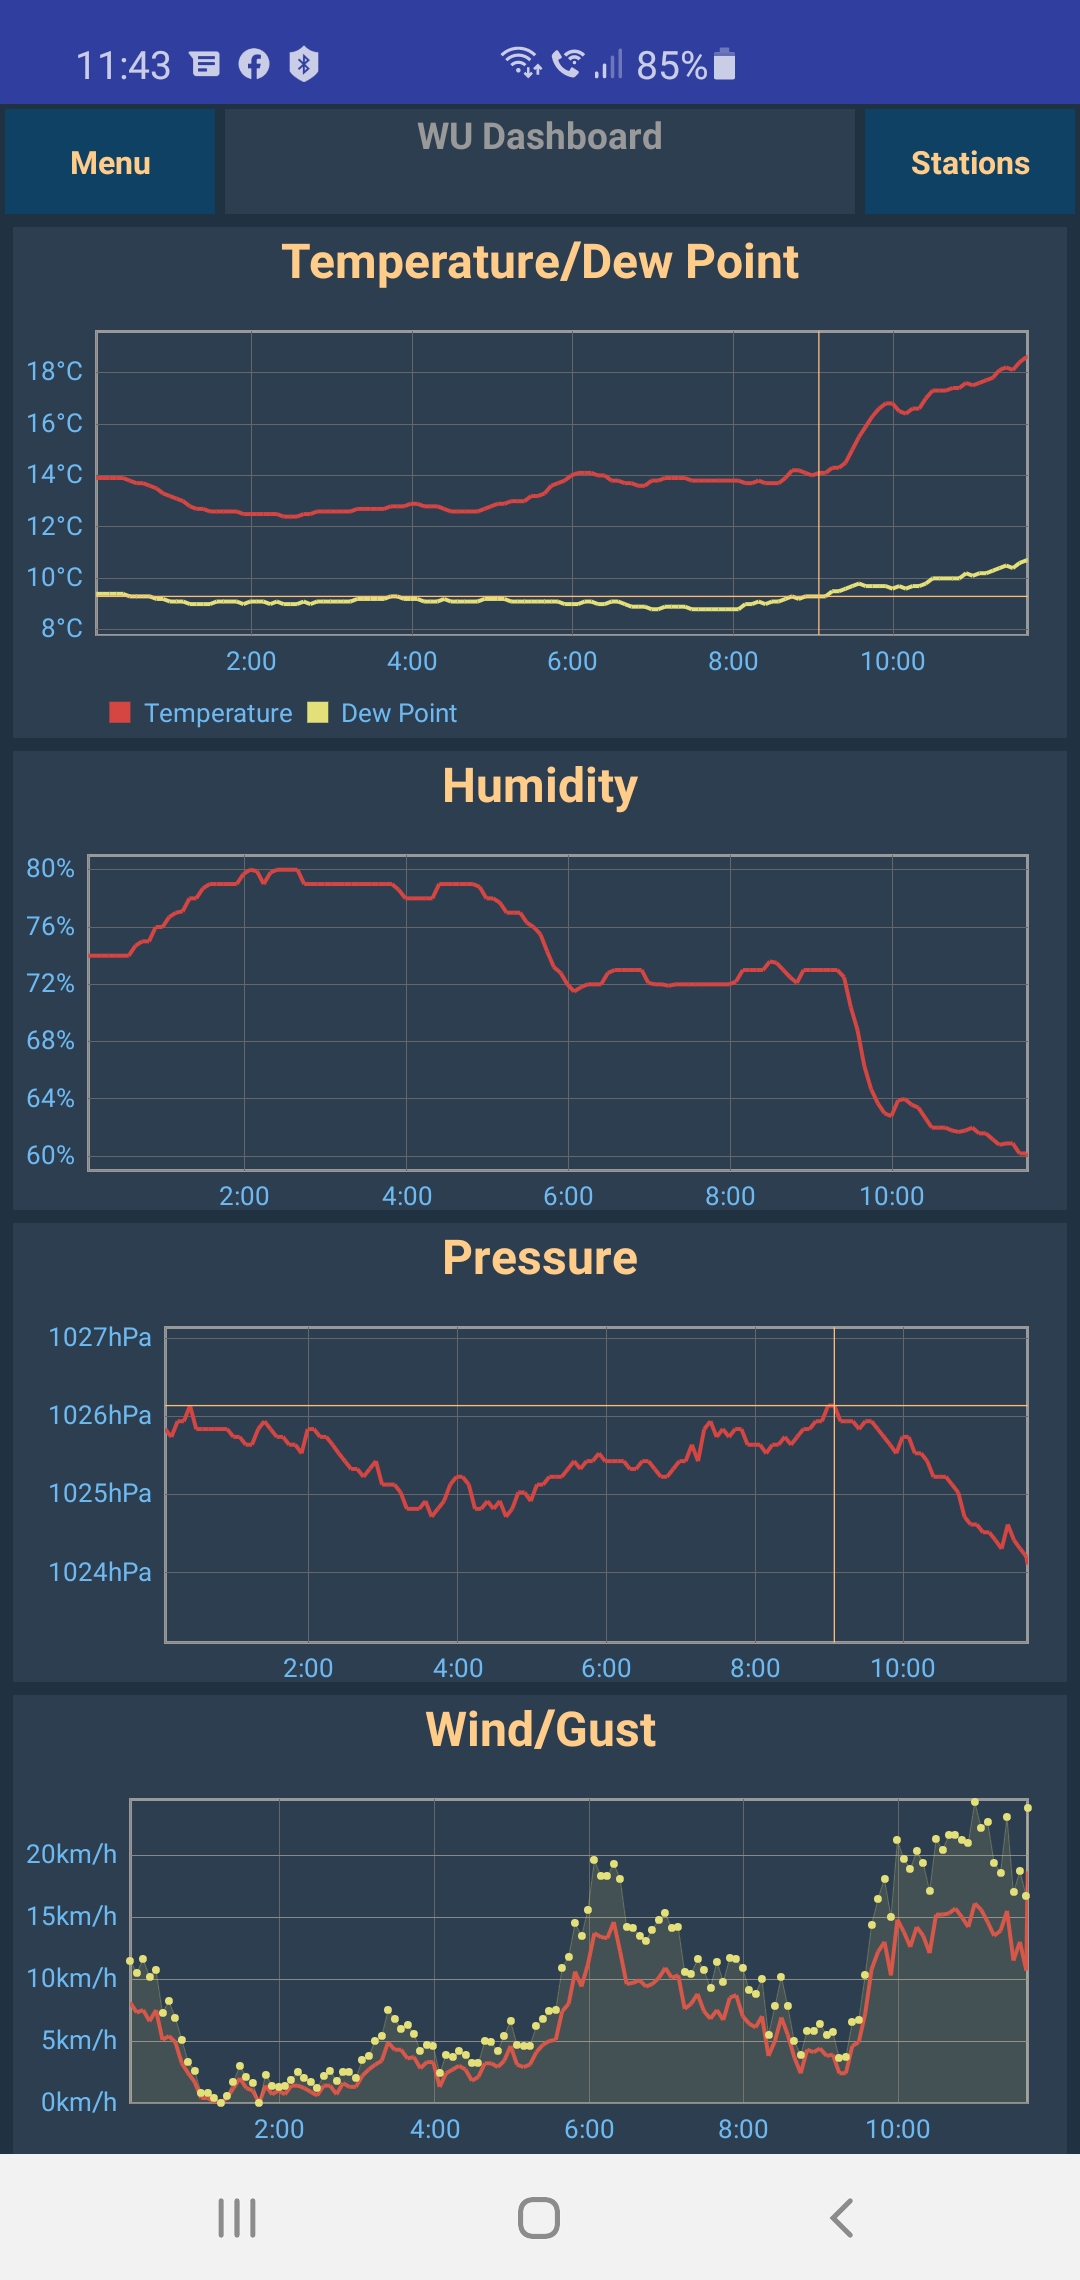
You can add additional weather stations to the app but only if they are registered to your account with Ecowitt.
B) The Ecowitt web site
You can view the data which the console has uploaded to the Ecowitt website using a browser.
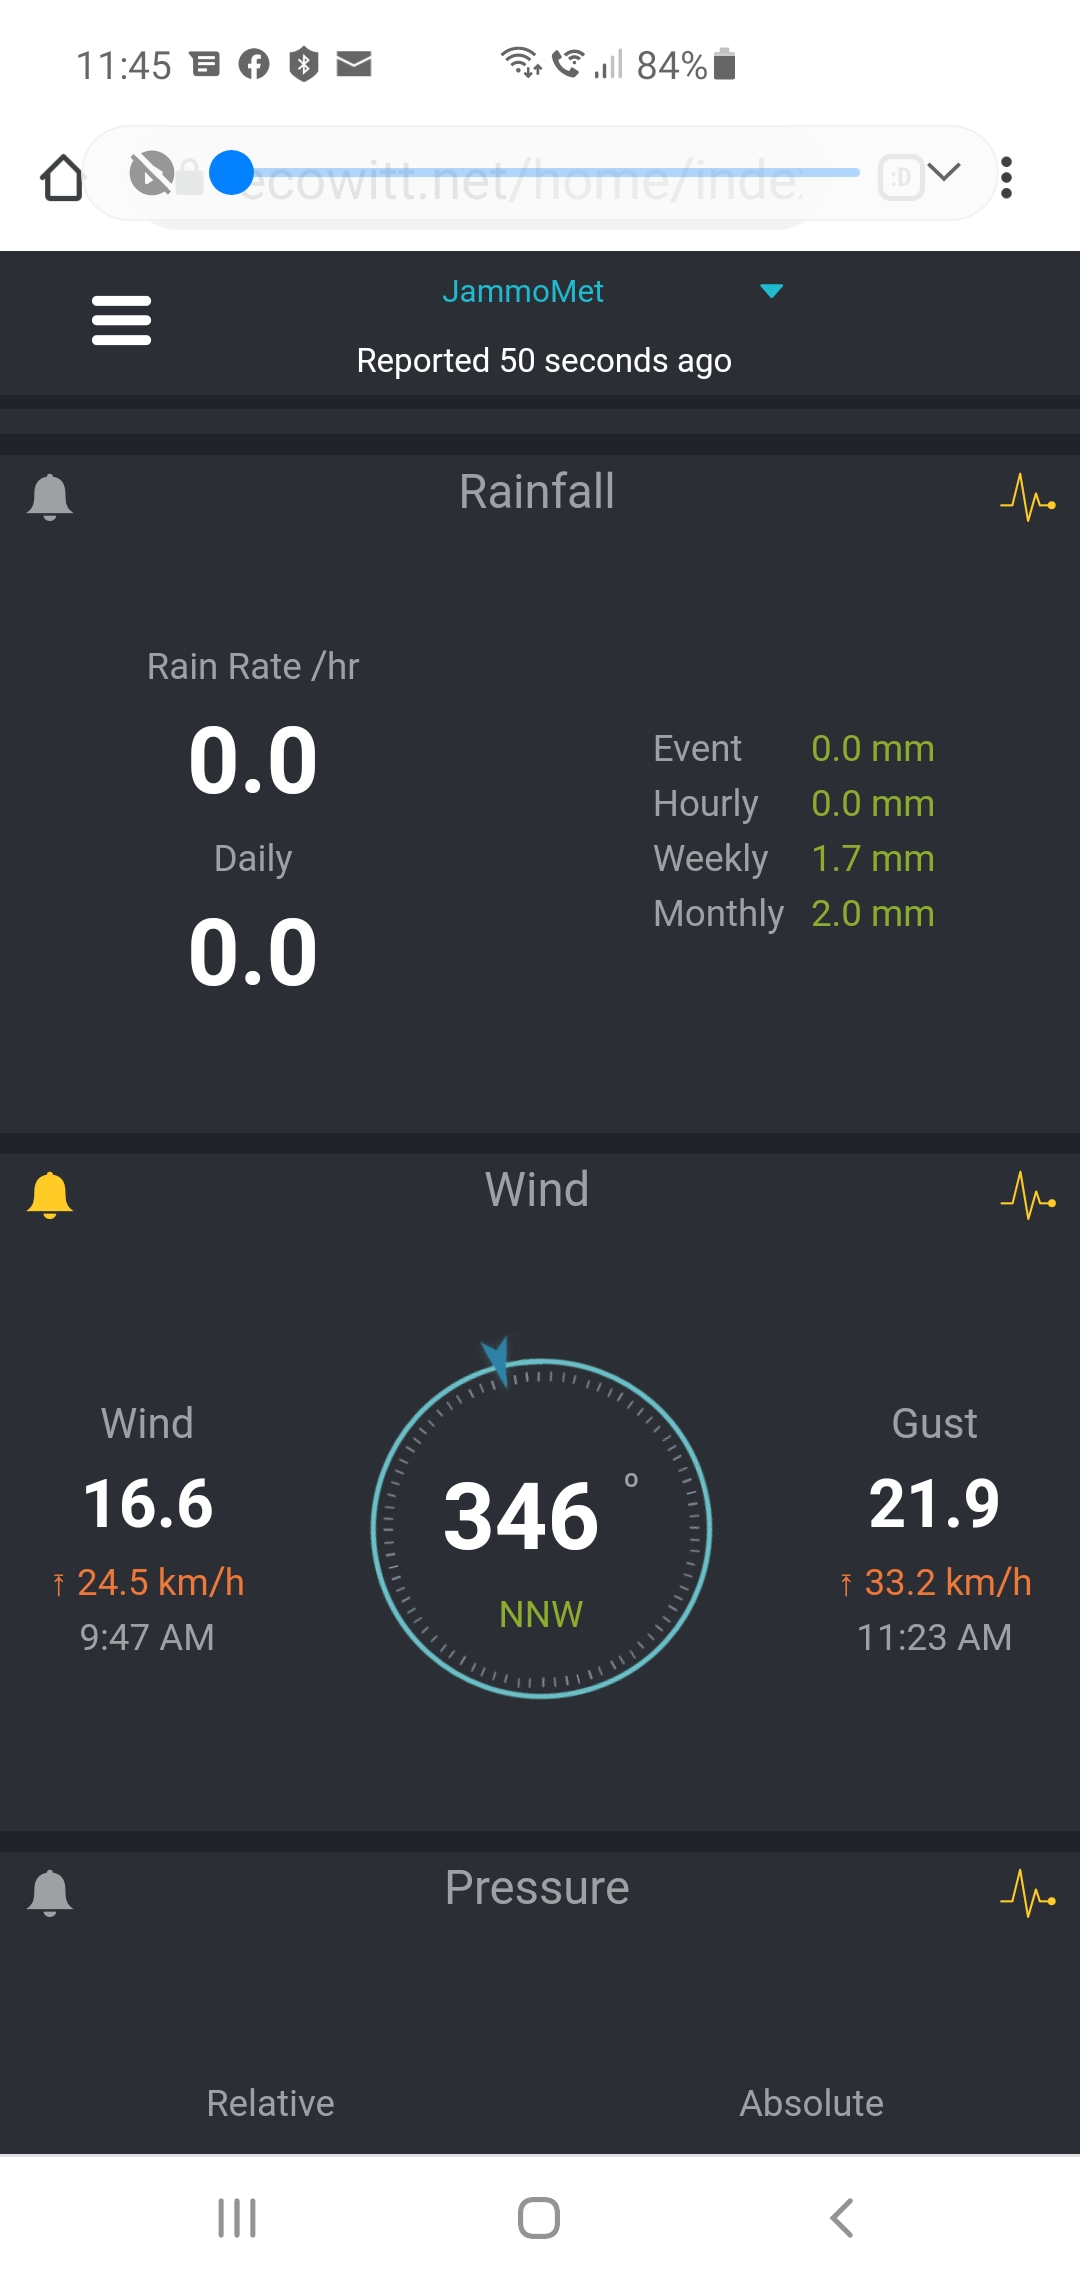
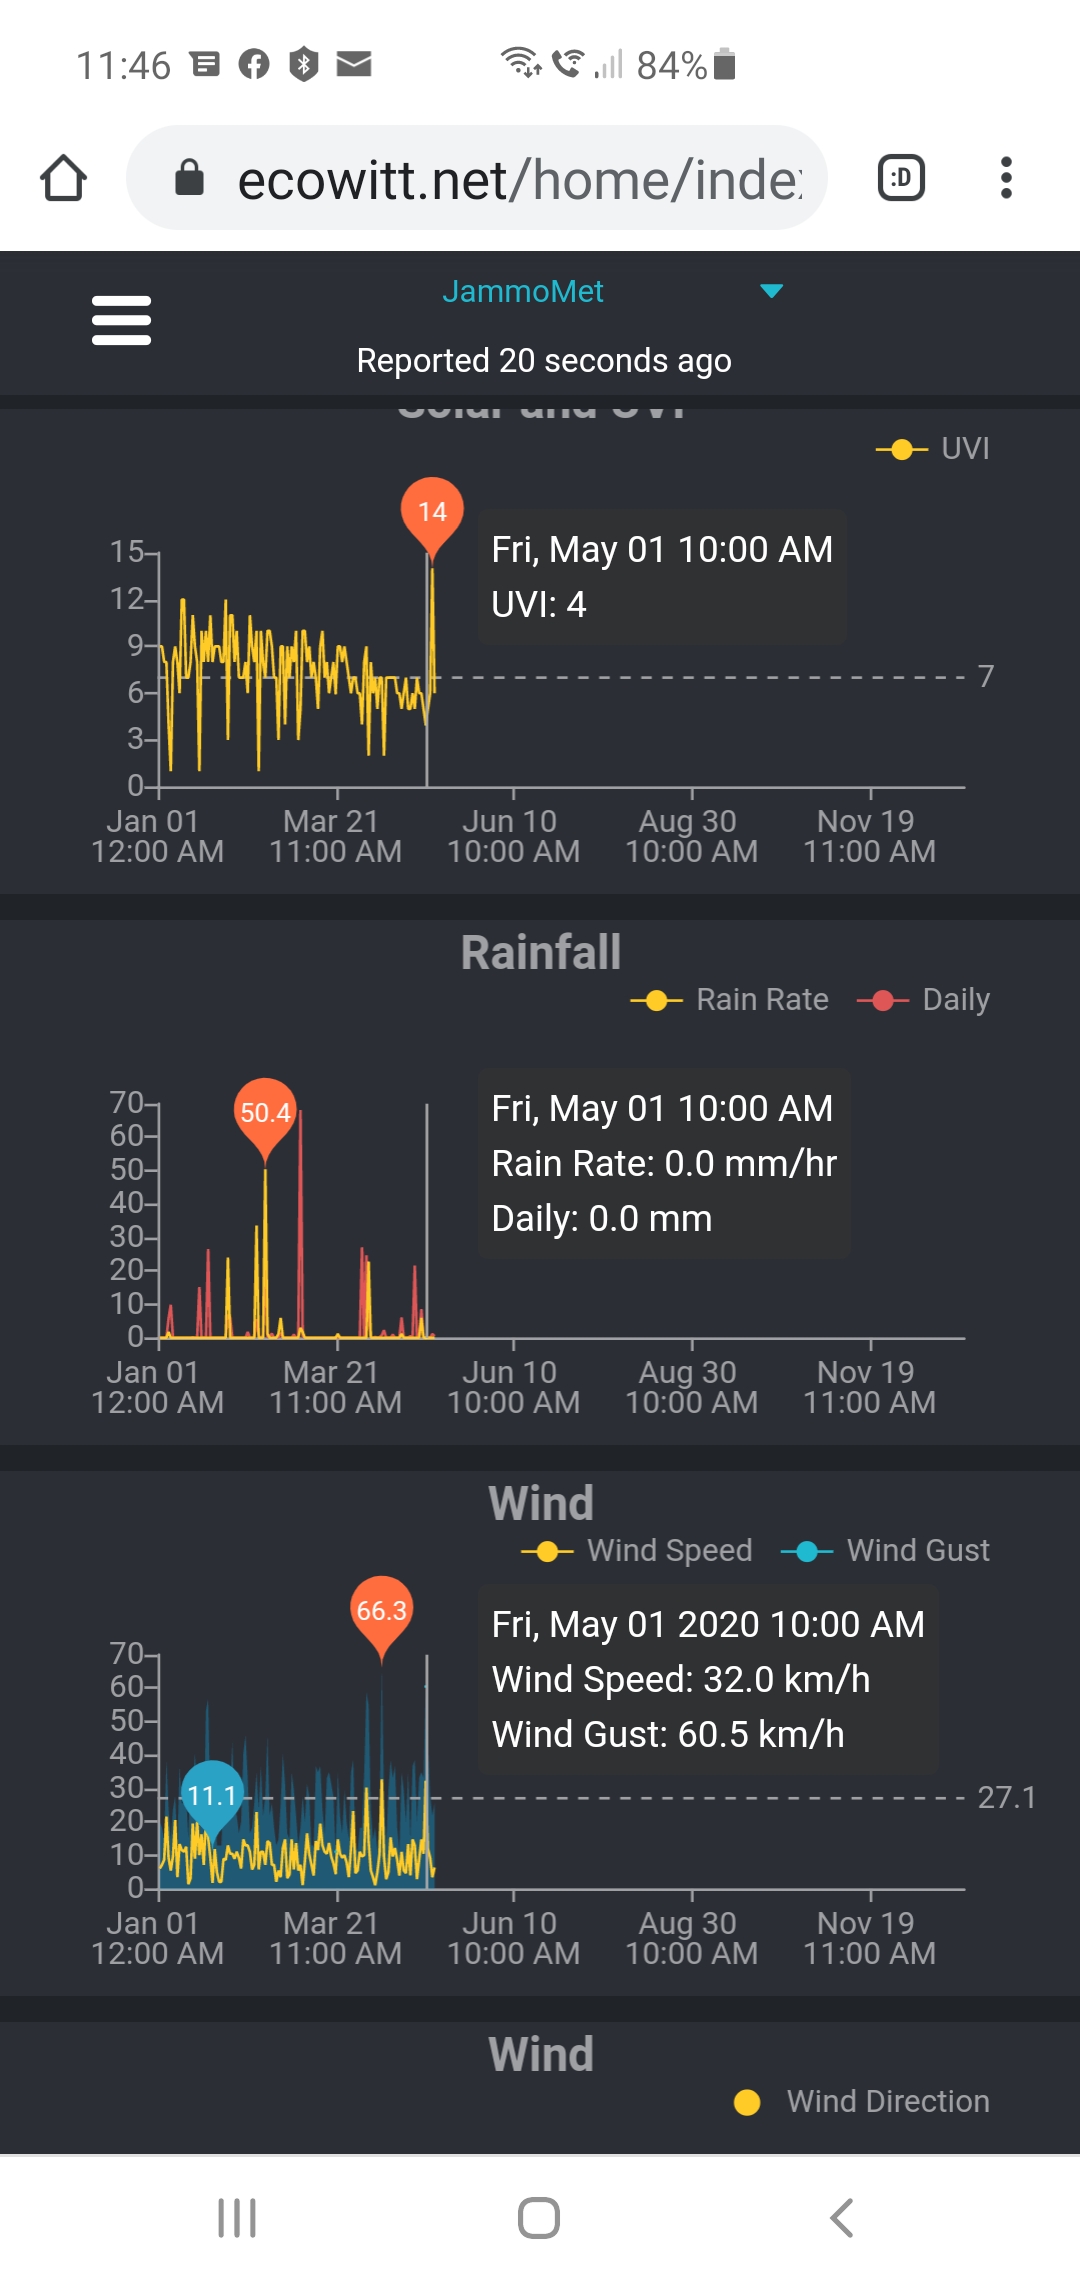
You can jump from analogue view to graphical view by pressing the little graph icon on the top right corner of each metric.
C) Weather Underground
The Weather Underground system is a communal system accepting inputs from many thousands of personal weather stations all around the world, as well as official weather data. It will present all your data, and those of personal weather stations in your area, and around the world. It also provides an API to pass data on to other services, and there are other systems and services that use that data. One of these is called Meteotemplate, which you can use to provide your data on your own web site using provided HTML templates and display tools such as gauges, dials and thermometers.
Weather Underground can be viewed using its web pages, or though a smartphone app. This is my page there.
This is a small snippet of my data at Weather Underground.
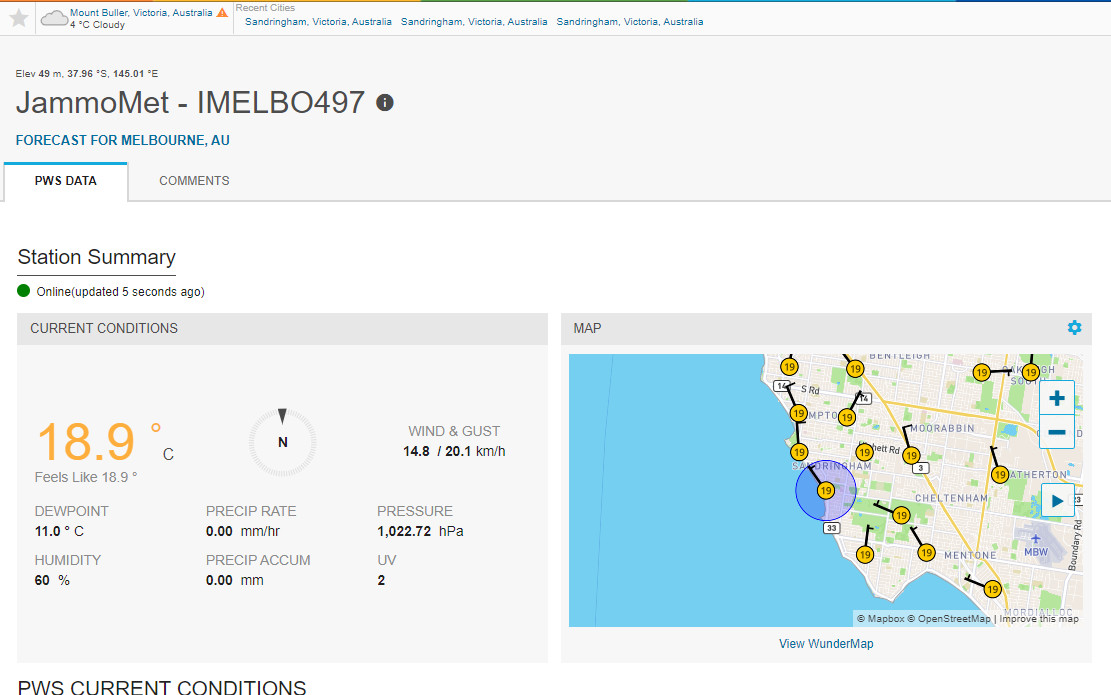
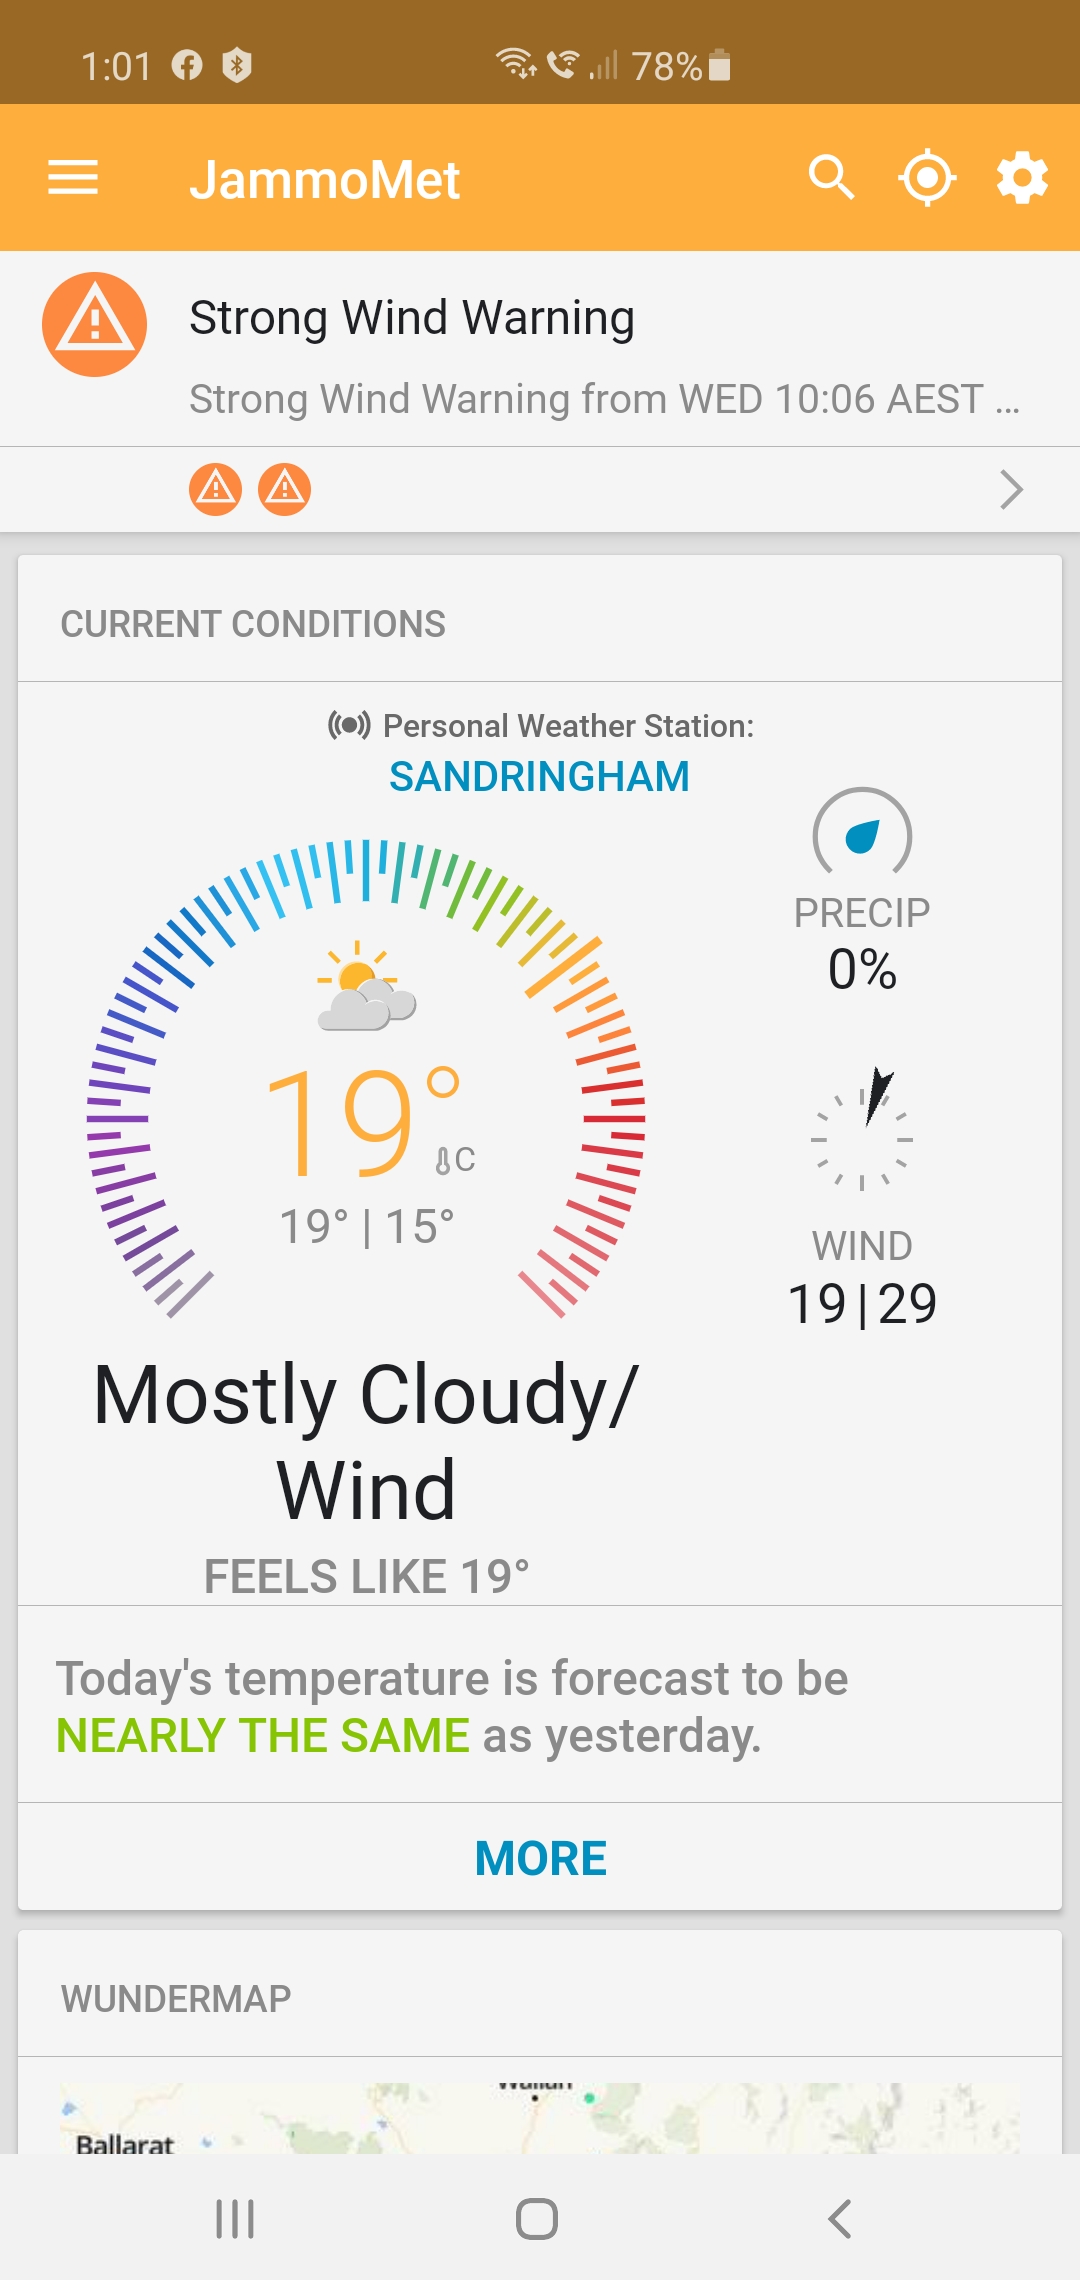
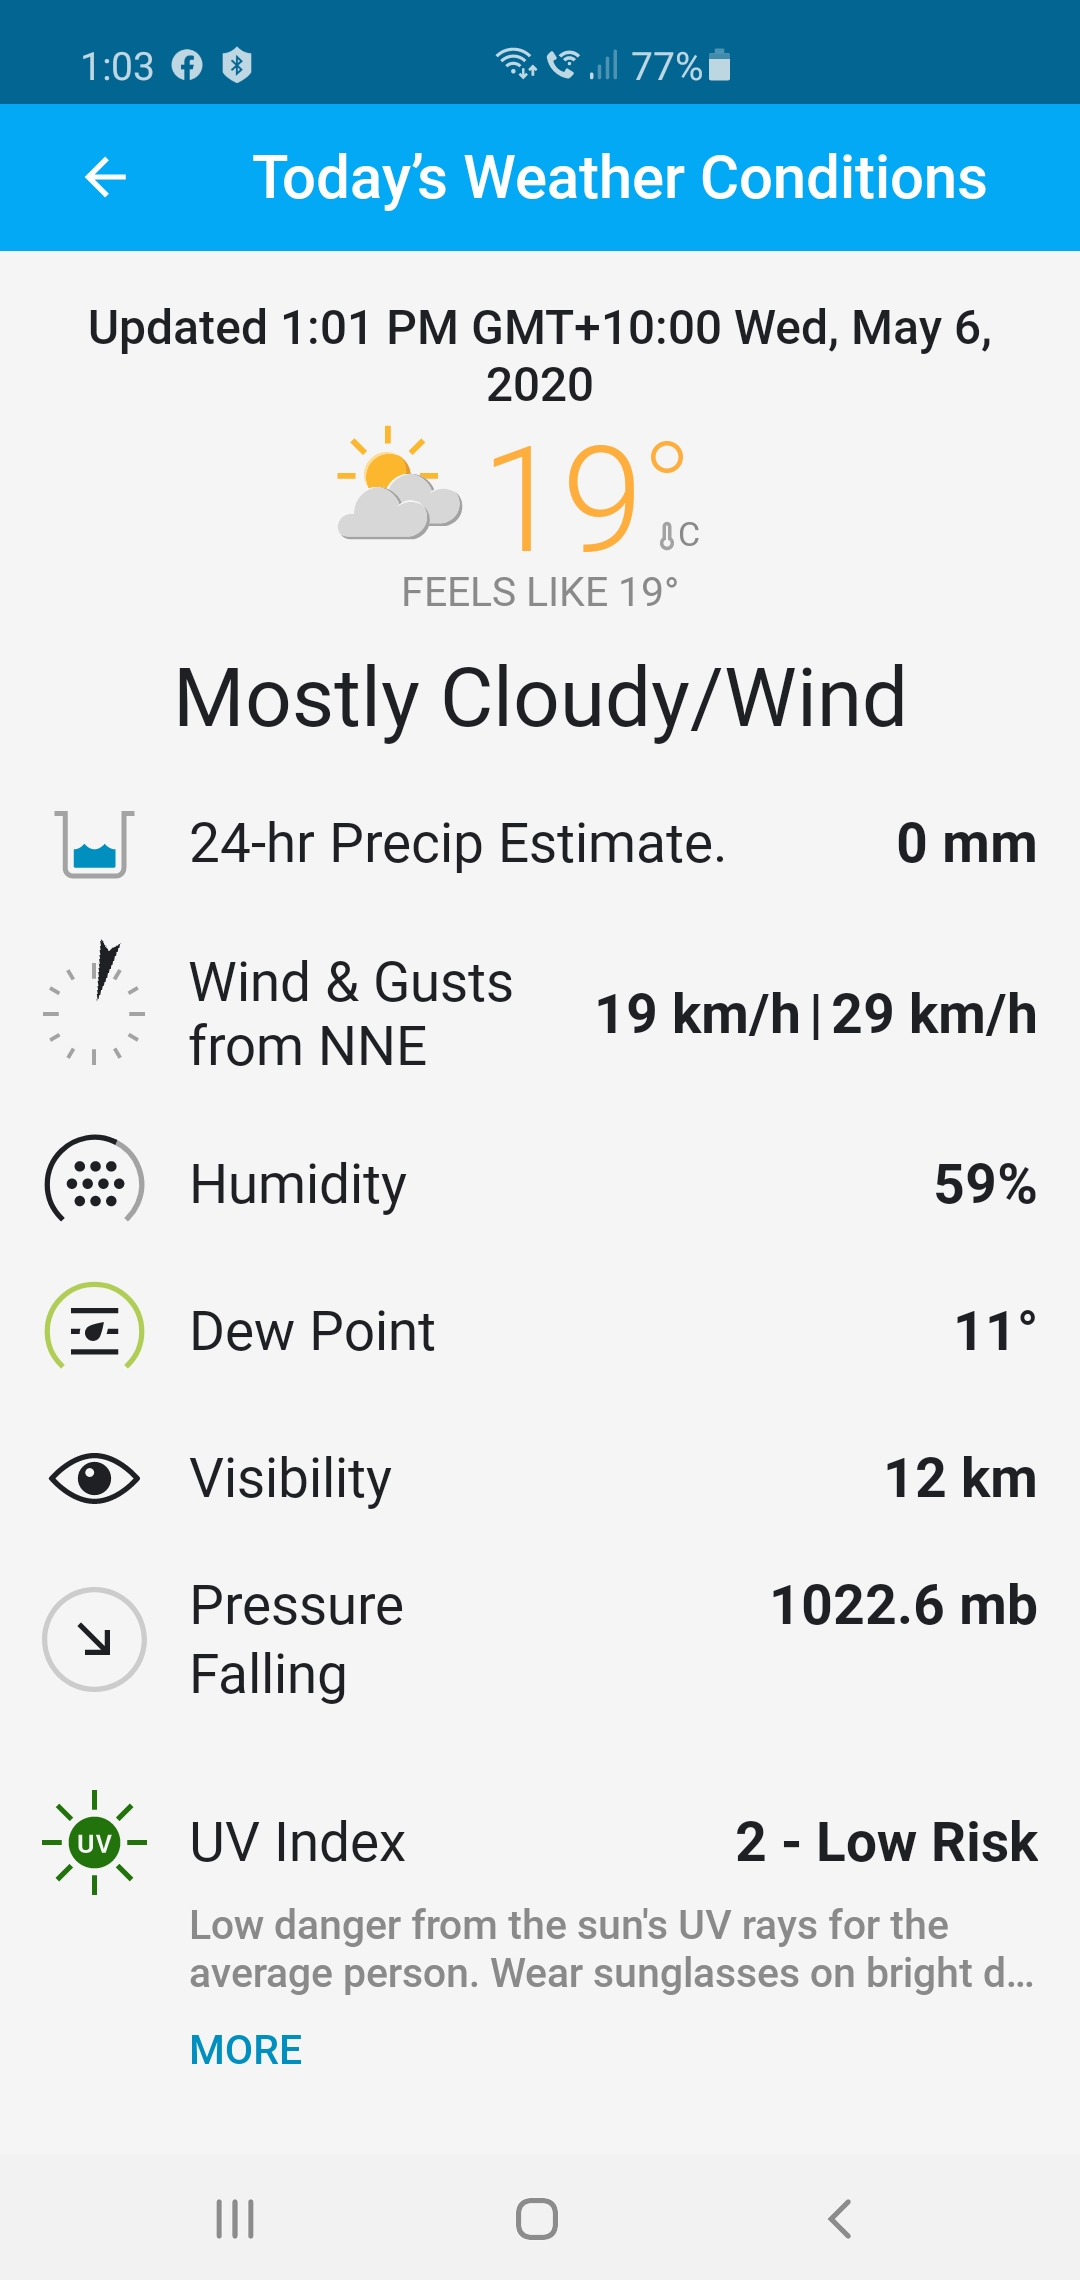
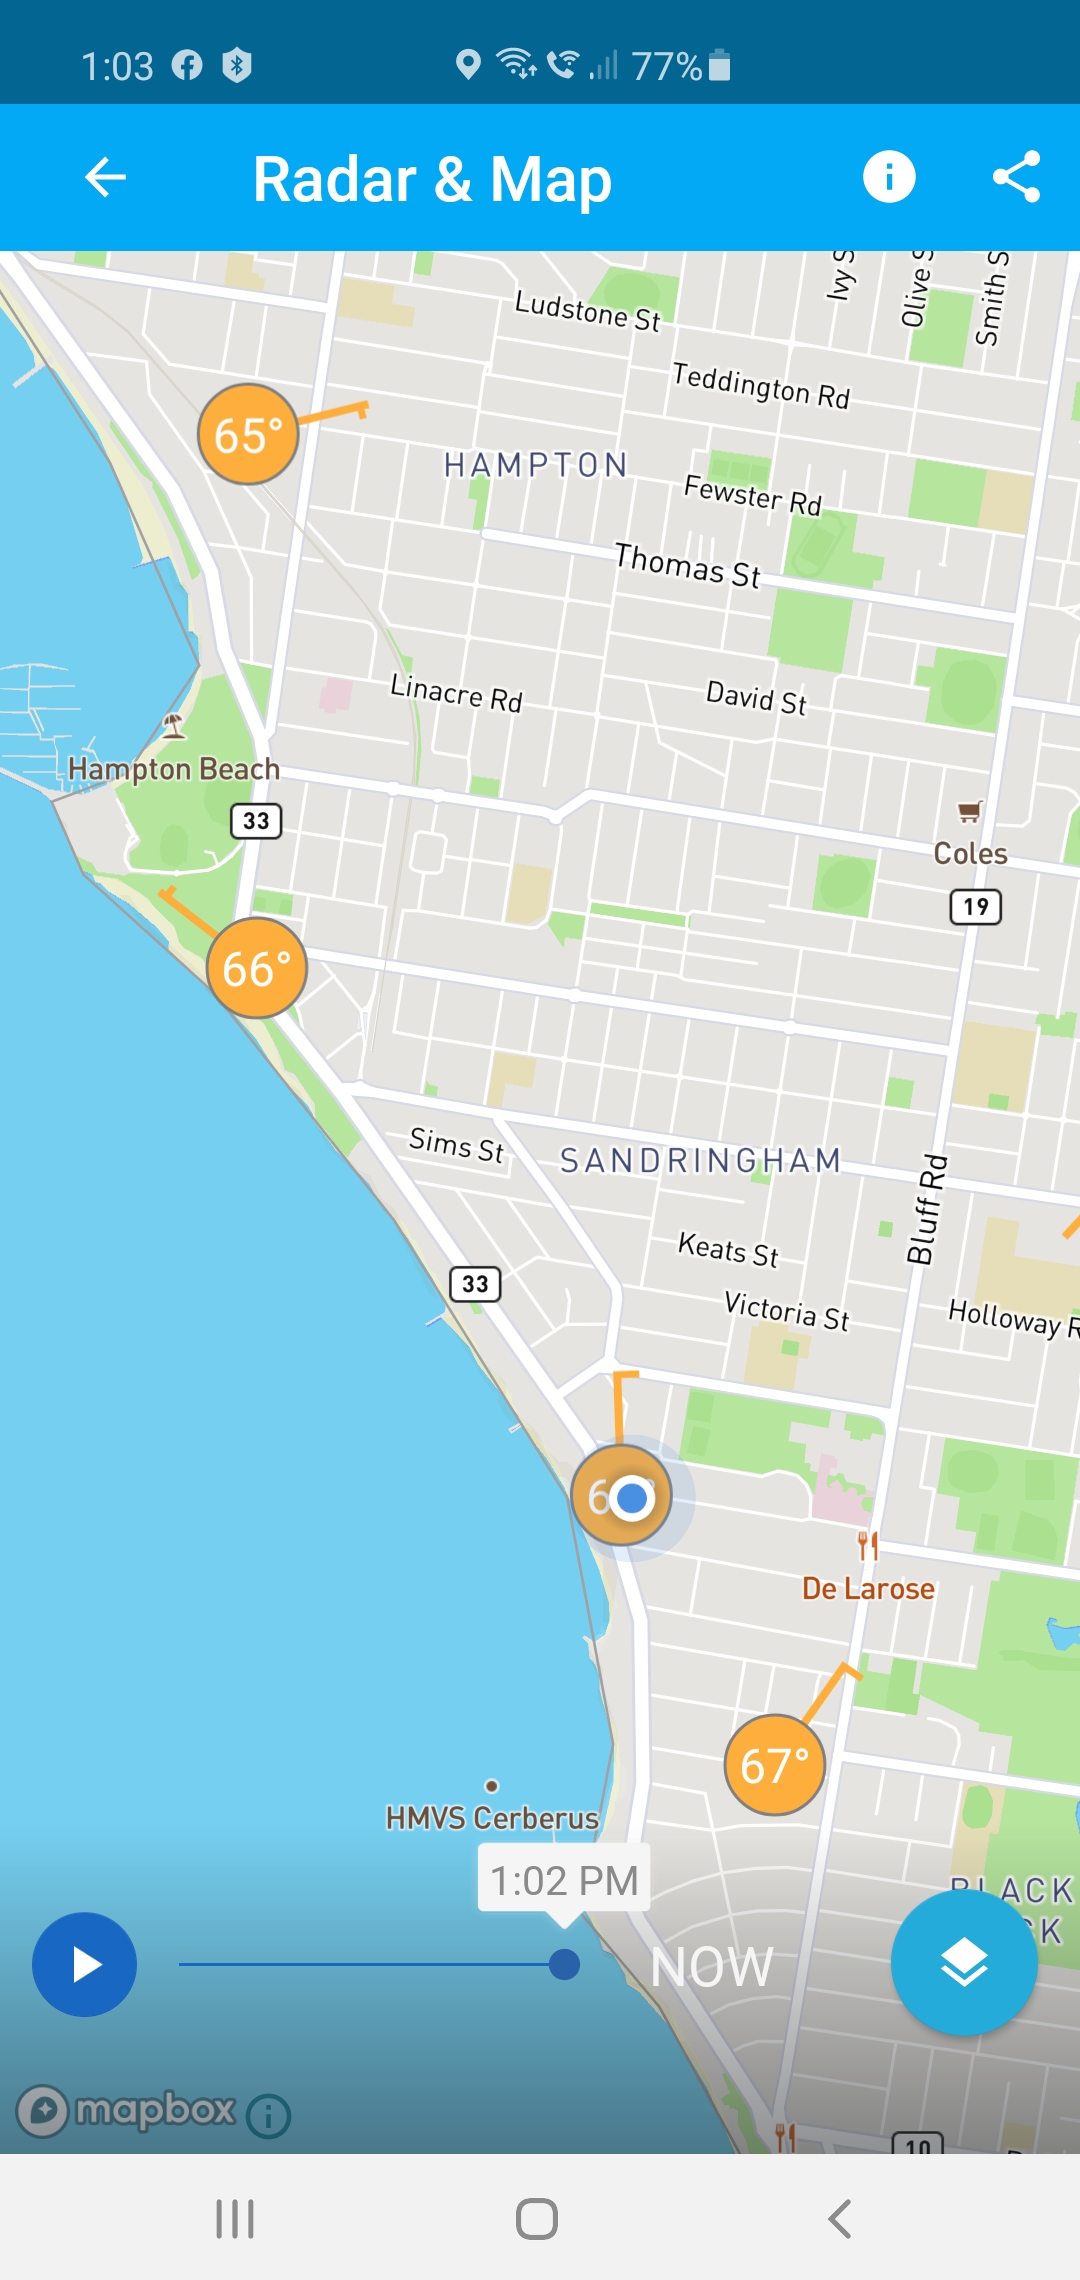
And here are some examples of data available through the Android version of the Weather Underground app. WUG is a bit flaky in the area of honouring the settings for Celsius / Fahrenheit
